Golf Course Revenue Analytics: Metrics to Track

A UK satellite account estimated golf's total Gross Value Added at £6.056 billion, with activities of golf clubs representing £796 million in direct Gross Value Added, according to A Satellite Account for Golf in the UK. That's the wider context, but it doesn't tell a committee whether its own club is earning well.
Good golf course revenue analytics starts with the constraint a club faces. Turnover can rise while contribution falls, rounds can fall while yield improves, and a new member can either add profit or take a tee time a visitor would've paid more for. The numbers below help you tell the difference.
Core Metrics for Golf Course Revenue Analytics
Which numbers show whether a club is earning well, and which ones only look good? Total turnover alone can't answer that, because it hides the mix. A club can grow turnover through busy, low-margin functions while membership yield weakens, or it can lose rounds and still earn more per member.
Start with eight metrics. They cover scale, member value, visitor yield, clubhouse capture, retention, conversion and profit by stream.
| Metric | How to calculate it | Review frequency |
|---|---|---|
| Total turnover | Sum of all revenue streams for the period | Monthly |
| Revenue per member | Member-generated income divided by active members | Quarterly |
| Rounds per member | Member rounds divided by active members | Monthly |
| Average realised green fee | Green-fee income divided by rounds played | Monthly |
| Ancillary spend per round | Bar, catering and retail income divided by total rounds | Monthly |
| Renewal rate by cohort | Members renewing divided by members due to renew, grouped by join year | Quarterly and annually |
| Visit-to-joining conversion | New members joining divided by visitors who trialled or visited with intent to join | Monthly |
| Contribution margin by stream | Stream revenue minus its direct costs | Quarterly |
Worked Example to Check Your Arithmetic
Say a club has 600 members and £720,000 of member income. Revenue per member is £1,200. If those members play 18,000 rounds, member income works out at £40 per round.
These figures are an illustrative example, not a benchmark. Their value is in the method. You can now compare that £40 with visitor income per round, society income per slot, and the direct cost of supporting each type of play.
Practical rule: Don't report turnover without the mix behind it. A rising total can hide a weakening core stream.
Review Rhythm and First Task
Review turnover, rounds per member, average realised green fee, ancillary spend per round and visit-to-joining conversion monthly. Review revenue per member, renewal by cohort and contribution margin quarterly, then review the full set annually.
Monthly metrics show operational movement. Quarterly metrics need enough renewals, costs and category changes to produce a reliable signal. The annual review should test whether the full-year mix improved, not just whether turnover rose.
Before you build anything more complex, gather twelve months of accounts, membership records and tee-sheet data. Calculate all eight metrics on one sheet for that period. That gives you the baseline every later decision should be judged against.
Where the Numbers Come From
Most golf course revenue analytics depends on your own records. External figures are useful context, but they can't tell you whether your Tuesday tee sheet, first-year members or bar operation is performing.
Your management accounts should split turnover by stream and identify direct costs for each one. Your membership register needs category, join date, fee and renewal status. Your tee-sheet system should retain rounds, tee times offered and booking source, while EPOS data should let you group bar, food and retail spend by time block.
| Source | What it gives you | Caveat |
|---|---|---|
| Management accounts | Turnover and direct cost by stream | Use for contribution margin, not budgets |
| Membership register | Members by category, join date and renewal | Needed for cohort renewal analysis |
| Tee-sheet and booking system | Rounds, tee times offered and booking source | Needed for realised green fee and yield per tee time |
| EPOS for bar, food and retail | Spend by time block and per round | Needed for ancillary spend per round |
| Members' club benchmark survey | Turnover bands, green-fee and bar benchmarks | Member clubs only; check the survey year |
| The Revenue Club figures | Green-fee income per club | Different sample from the members' club survey |
| England Golf membership data | Total, junior and iGolf membership | National totals, not club-level |
| Golfshake golfer survey | Waiting lists and expected price rises | Opinion survey of golfers, not revenue data |
Compare trends within one source wherever possible. Different samples, club types and survey years can produce different averages, so state which source you've used and don't splice figures together as if they were one data set.
Society and event records need the same discipline. Record enquiry date, deposit date, event date, package value and whether the organiser rebooked, or you won't be able to measure lead time and repeat value later.
Where Club Income Comes From and What UK Clubs Earn
A full tee sheet can still leave a club short if extra visitor demand mainly displaces member play at peak times. Start from the constraint: is the club short of enquiries, short of bookable peak capacity, or short of spend once people arrive? Then separate member subscriptions, green fees, bar and food, societies, events and functions, retail and other ancillary income, and compare each stream with total turnover, direct cost and the capacity it consumes.
The Hillier Hopkins Golf Clubs Report 2024-25 found that 77% of members' clubs reported annual turnover above £1 million in 2024, up from 68% in 2023, while only 3% generated less than £600,000 in 2024, compared with 11% the previous year. It also found that 87% of members' clubs generated more than £60,000 in annual green-fee income in 2024, compared with 80% in 2023.
| Revenue stream | UK benchmark | What it tells you |
|---|---|---|
| Member subscriptions | No directly comparable published average; measure member-generated income against turnover and renewal | Whether the core base is funding the operation |
| Green fees | Benchmark internally by realised fee and yield per tee time | Whether visitor demand adds profit or only shifts play |
| Bar and food | No published UK benchmark found; use your own two-year history | How well a busy day converts into clubhouse spend |
| Societies and events | No published UK benchmark found; use your own two-year history | Whether group income offsets quiet visitor months |
| Retail and other ancillary | No published UK benchmark found; use your own two-year history | Whether small streams are worth managing separately |
The Share Check
Divide each stream by total turnover to find its share. Put the last two years in adjacent columns and ask whether each share is rising or falling.
Then look at capacity, not turnover alone. Compare member income per member and per peak tee time used with green-fee income per available peak tee time. If visitor income rises while peak member access falls, the club may have traded scarce capacity rather than added profit. If green fees rise on off-peak times without reducing member rounds, the extra demand is more likely to be additive.
A strong bar with a weak green-fee share points to a different problem from strong membership income with an empty society calendar. A broader explanation of how golf clubs make money across subscriptions, visitor yield and ancillary spend is useful here, but your own changing mix should drive the decision.
Societies and events need separate measures. Track income per booked society slot, lead time from first enquiry to deposit, the share rebooking within twelve months, and events income per function room per month.
Green-fee averages are easy to mix up. The Revenue Club figures reported by The Golf Business put average green-fee income at £189,240 per club in the UK and Ireland in 2025, a different sample from members'-club surveys, so name the source and stick with it.
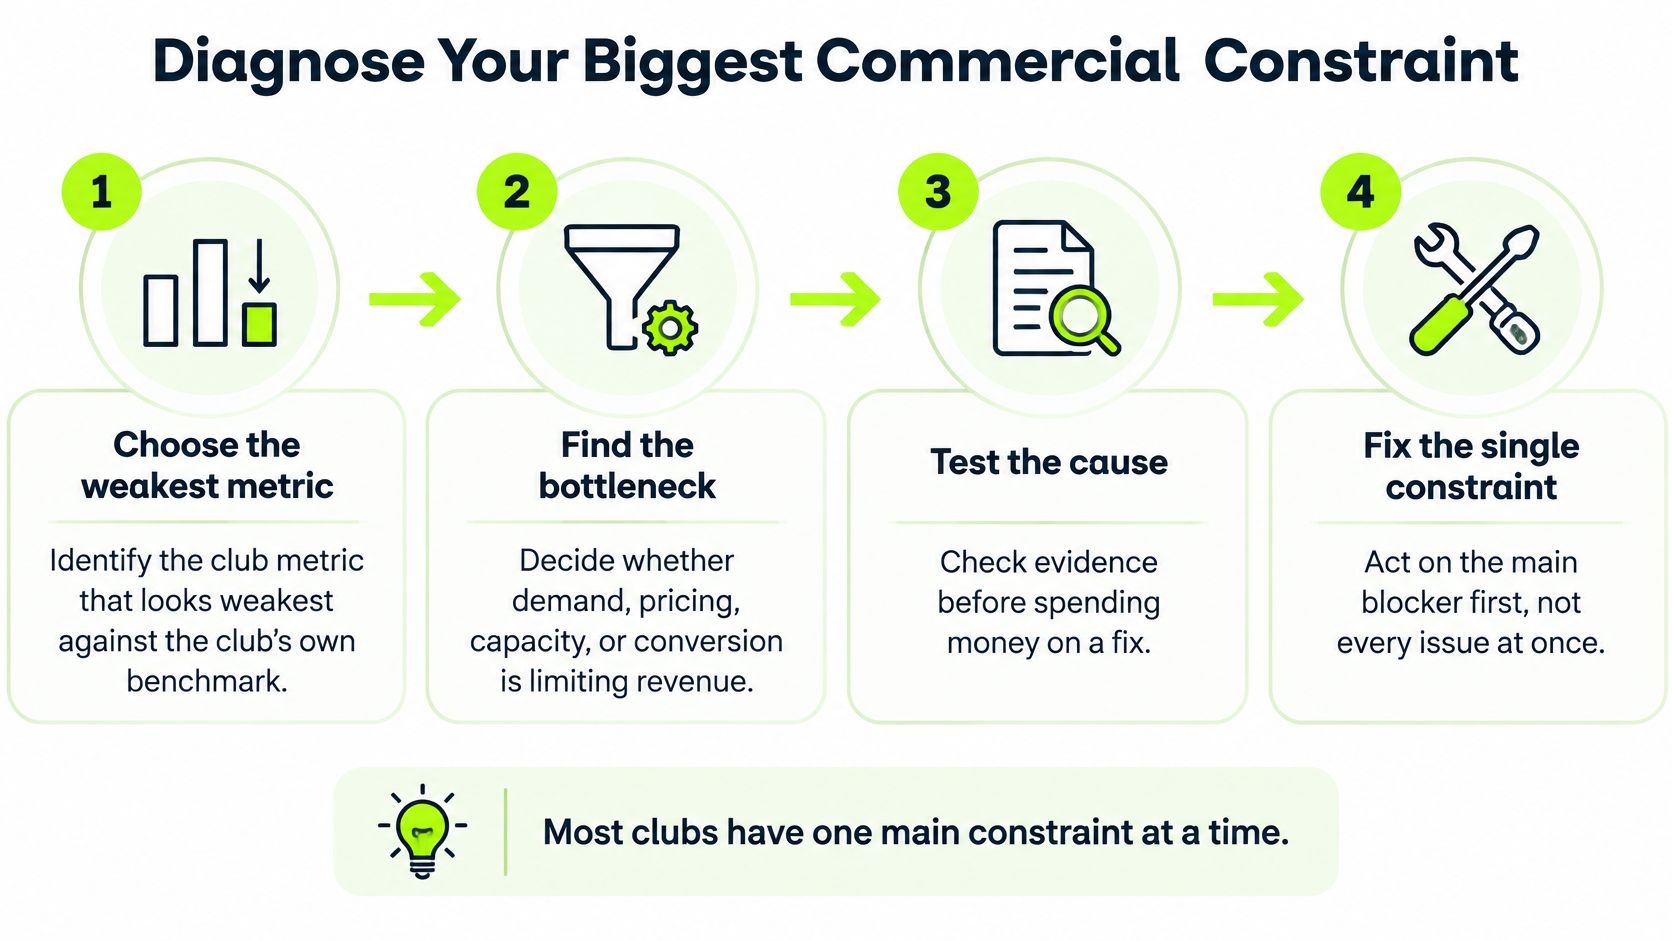
Diagnose Your Biggest Commercial Constraint
Most clubs have one main constraint at a time. Spending before you've identified it usually treats a symptom, and it can make another part of the business worse.
Work through four steps.
- Choose the weakest metric: Compare your core metrics with your own last two years and pick the one that's moved furthest in the wrong direction.
- Check source-level data: Break the problem down by day, time block, membership category, booking source or customer type.
- Change one lever: Test one price, one onboarding contact, one package or one booking rule for a fixed period.
- Measure both sides: Track the target metric and the metric your change might harm.
| Symptom in your data | Likely constraint | First test |
|---|---|---|
| Waiting list and full tee sheet at peak times | Capacity | Compare yield of peak slots with visitor and society demand |
| Strong enquiries but few joins | Conversion | Check visit-to-joining rate and lost reasons by stage |
| Joins are steady but first-year leavers rise | Onboarding and retention | Review first-year renewal by join cohort |
| Weekday tee sheet stays empty | Demand | Measure visitor bookings by source and day of week |
| Turnover flat while rounds fall | Yield | Compare average realised green fee and ancillary spend per round |
| Busy days but low bar spend | Ancillary capture | Track spend per round by time block |
Choose by Return on Management Time
Fix the constraint that limits the most revenue per hour of management time, not the one with the largest headline gap. A full Saturday and an empty Tuesday are both capacity problems, but they're not equal. A peak-price adjustment works with demand you already have, while a midweek campaign adds cost and may still not sell the slot.
Don't judge a green-fee increase on green fees alone. If rounds, bar spend or repeat bookings fall far enough, higher yield can still reduce contribution.
Keep the monthly report to one page. Show turnover by stream, the chosen constraint, the action taken and the result after one full quarter. Name the constraint in writing and state the metric that will prove whether it's moved.
Membership Income Beyond Headcount
Headcount doesn't equal revenue. Categories carry different fees, playing rights, usage patterns and renewal behaviour, so a growing membership can still produce weaker revenue per member if the mix shifts towards lower-yield products.
The Hillier Hopkins Golf Clubs Survey Report 2025-26 reported average turnover of approximately £1.5 million for UK members' golf clubs, with 72% exceeding £1 million. It put average member-generated income at £1.16 million and average green-fee income at £172,000, which shows how heavily the model still depends on members.
The same survey reported that average member rounds fell from 32,000 in 2024 to 30,000 in 2025. That decline doesn't automatically mean poorer performance. You need to separate volume from yield.
Volume Versus Yield
Rounds can fall while income holds up if subscription prices rise, members move into higher-value categories or ancillary spend increases. The opposite can also happen. A busy course can look successful while low-yield categories consume peak capacity and reduce the space available for visitors, societies or full-fee members.
Report these measures separately.
- Revenue per member category: Member income for each category divided by active members in that category.
- Renewal rate: Members renewing divided by members due to renew, split by category and join year.
- Upgrade rate: Members moving from introductory, flexible or junior products into higher-value categories.
- Junior share: Junior members as a share of total membership, tracked alongside their progression.
- Independent-golfer conversion: Golfers moving from independent or flexible routes into club membership.
Understanding customer lifetime value helps here, because a member who joins cheaply, renews and upgrades can be worth more than a higher-fee member who leaves after one year.
The Cohort Test
Group members by join year and compare renewal at twelve and twenty-four months. Then compare usage and ancillary spend for the same cohorts. This shows whether a recruitment route or category creates durable value, rather than a short-lived increase in numbers.
Use a clear decision rule. If a lower-fee category renews at a similar rate to established categories and a meaningful share upgrades within two years, it's building value. If most leave in year one and few progress, it's diluting revenue per member and may be consuming onboarding capacity.
Committee test: Don't ask only how many members joined. Ask which join cohort is still here, what each category pays, and who upgrades.
Split membership revenue by category this quarter. Put members, income, rounds, renewal and upgrades side by side. That's a more useful growth discussion than headline headcount alone.
Visitor Yield and Tee-Sheet Pricing
The yield gap between member and visitor play is easy to misread. Hillier Hopkins golf club benchmarking put average member-round cost at £43.50 in 2022, up from £36 in 2021, while average non-member green fees increased from £84 to £108 over the same period.
That doesn't mean every member slot should become a visitor slot. Visitor demand changes by season, weather, course condition and booking channel, and distribution fees can reduce the headline fee. Capacity also has a member-experience cost.

Revenue per Available Tee Time
Use green-fee revenue per available tee time. Divide green-fee income by all tee times offered in the period, not just the ones sold.
Say a club offers 200 weekday tee times in a month, sells 150 and earns £9,000. Revenue per available tee time is £45, even though revenue per sold round is £60. Compare the £45 with what a member, visitor or society would contribute from the same slot.
Only then add downstream value, including bar spend, pro shop purchases, repeat play and membership enquiries. A slot with a lower green fee can still win overall if it produces enough repeat or ancillary value.
Price by Block, Not by Blanket Discount
Test weekday mornings, twilight, weekend peaks and shoulder months separately. Include booking lead time and weather in your review, because a price that works for an early booking may fail for a late, weather-dependent one.
Blanket discounting is blunt. It cuts income from golfers who would've paid the original price and teaches others to wait. Adjusting one block at a time gives you cleaner evidence and protects stronger periods.
Technology can help apply the rules consistently. Faberwork's thinking on smart controllers for improved profitability is relevant where pricing, inventory and operating decisions need tighter control, but the commercial rules still need to come from your own tee-sheet data.
Run a six-week test on one block. Change the price, then compare yield per available tee time, rounds sold, ancillary spend and repeat play with the same block a year earlier. Don't extend the change across the tee sheet until that evidence is clear.
When Acquisition Spend Pays and When It Shifts Demand
Should you spend more to win members? Rising participation doesn't answer that question on its own, because a new member needs somewhere to play.
England Golf membership increased from 730,602 in 2024 to 750,071 in 2025, a 2.66% year-on-year rise, while junior membership increased from 46,028 to 61,483 and iGolf subscribers reached 72,921, according to England Golf membership figures reported by Golf Business News. Those are useful national signals, but your decision depends on local capacity and category economics.
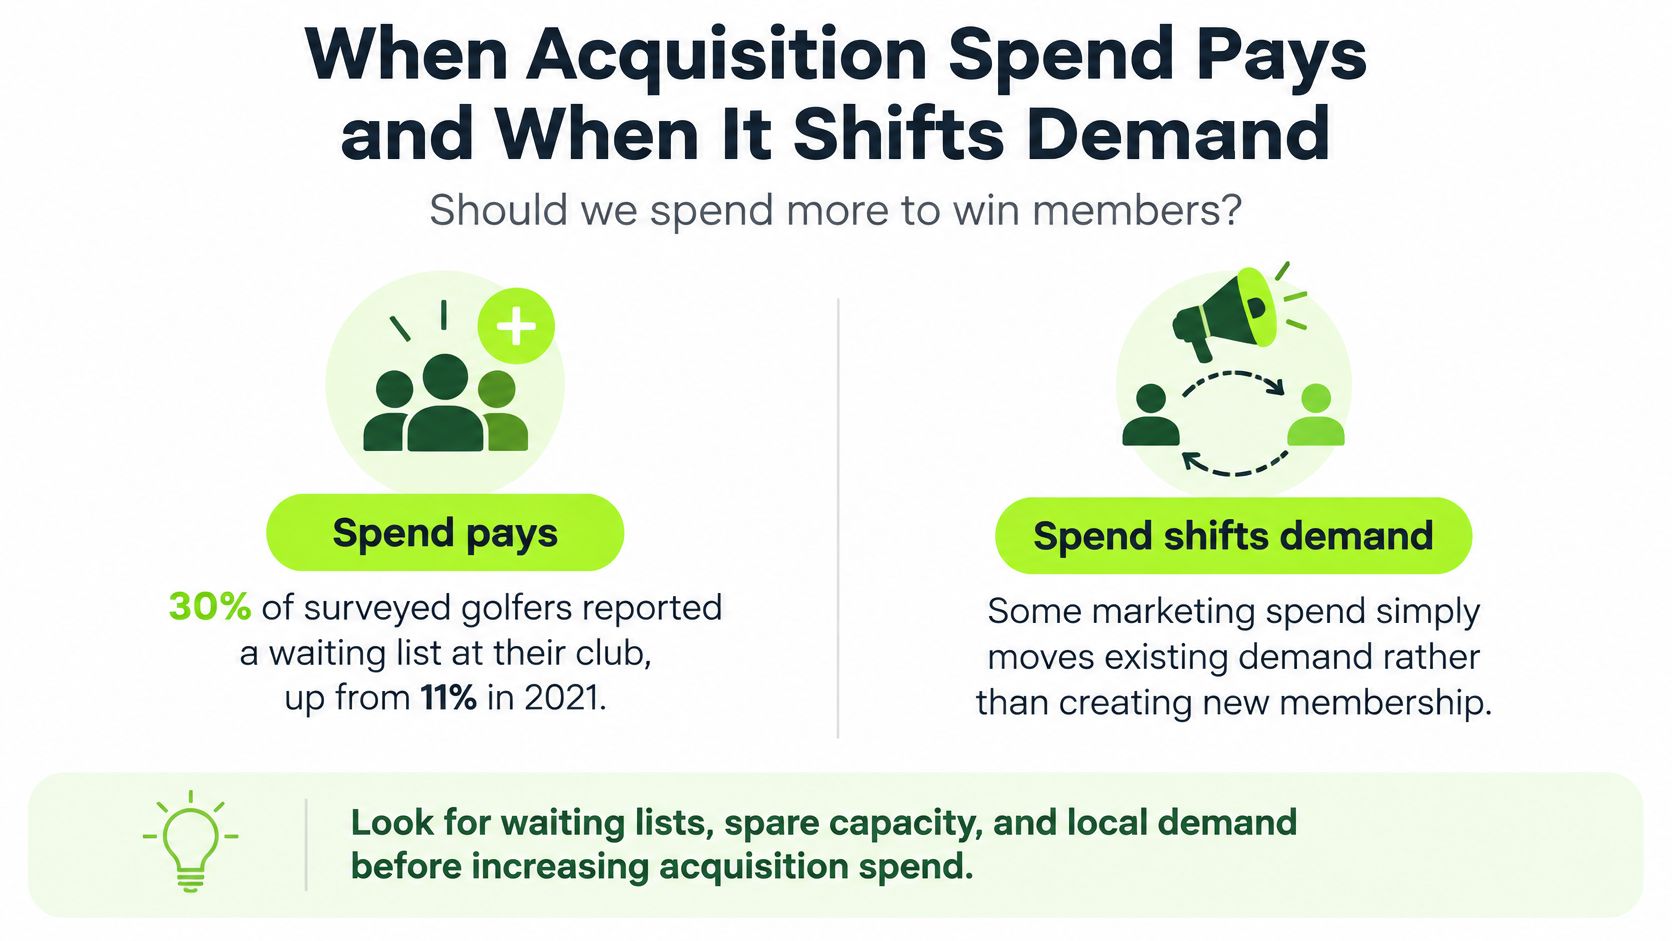
Demand signals can point both ways. Research reported by Glenmuir found Golfshake reporting that 30% of surveyed golfers reported a waiting list at their club, up from 27% in 2024, and 81% expected membership costs to rise again in 2026, which is why the current participation and waiting-list context needs to be read alongside your own tee sheet. Where peak times are already full, more acquisition may lengthen queues rather than create useful capacity.
Build the Two-Column Comparison
Column one covers a new member. Include acquisition cost, joining fee, first-year subscription and ancillary spend, then deduct onboarding cost and the value of tee-time capacity used.
Column two covers the same capacity sold another way. Include visitor or society green fees, food and beverage income, direct costs and any repeat-booking value. Jumpstart Partners explains how to connect acquisition costs to profitability, which is the right principle for this comparison.
Track cost per visitor, visit-to-joining conversion, first-year retention and lifetime contribution margin by source. Clear attribution rules matter because a golfer may visit several times before joining.
If you've got a peak-time waiting list and rising visitor yield, improve yield and retention before buying more acquisition. If off-peak capacity is empty and a weekday product can use it without harming peak access, targeted spend may pay. Put the two columns in front of the committee using your own accounts.
Set Your First Test for the Next Quarter
Start with the constraint you've identified and choose one lever for the next quarter. Use your twelve-month core sheet as the baseline, so the committee can see what has changed.
First, log why members left during the last twelve months and why visitors who considered joining didn't join. GolfRep recommends logging lost reasons because it helps a club see if price is a messaging problem, a weak tour experience is an operational problem, and inconsistent follow-up is a process problem. Keep those codes separate.
Second, report by source, not total enquiries. GolfRep recommends reviewing stage-by-stage conversion, speed-to-lead, visit-to-join performance, source-level revenue, and retention at the 90-day mark. If you're testing alternative web journeys, RedirHub explains how to compare landing page variants using redirects, but only change one route at a time.
Third, book the review date now and hold it with the committee, not only the sales team. GolfRep's process focuses on response speed, visibility, and booked visits in month one, and source quality, conversion consistency, and retention in month twelve. Your quarterly review should show turnover by stream, the metric that moved and whether contribution margin improved.
You can run that review internally with your accountant or PGA professional, or use external support. The commercial lesson is the same. Analytics only pays when it changes a decision the committee makes.
If you'd like help turning your membership, visitor, society and events figures into a clear set of commercial priorities, GolfRep can help you identify the main constraint and measure the test that follows. Visit GolfRep to discuss a practical revenue review for your club.
Ready to tap into our proven growth system?